Use of arrow keys when focused on the Google language option field will translate site content on the fly. Use your enter key to review all options and choose your selection before applying.
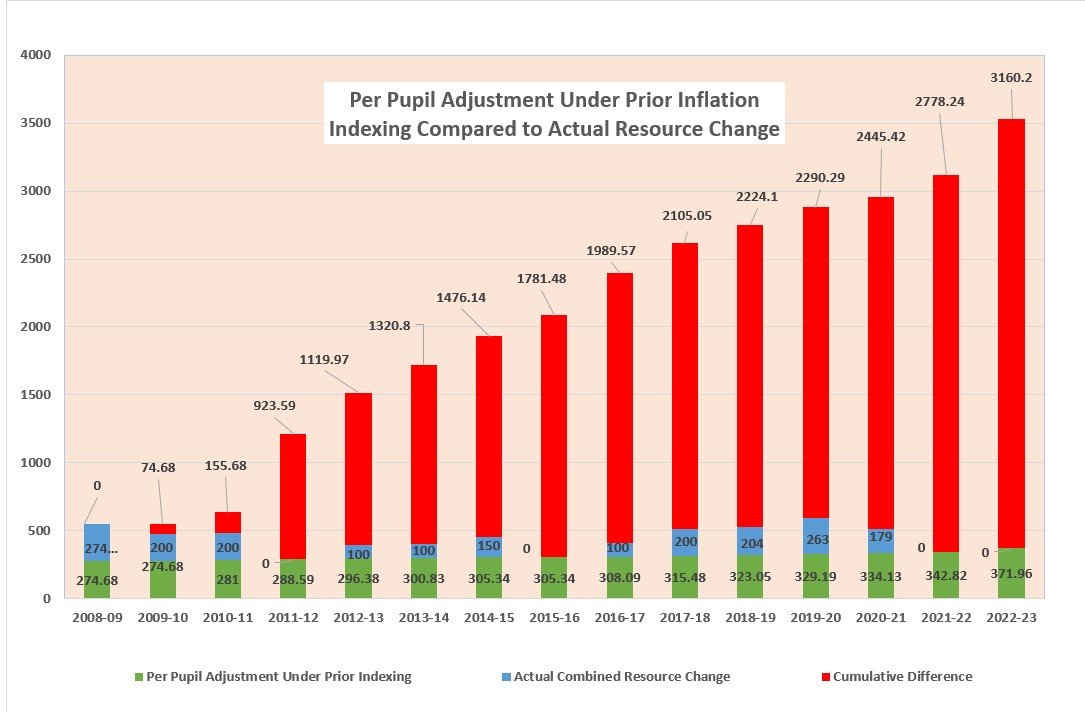
Per Pupil Adjust Actual Compared to PPA Under Prior Inflation
The graph shows the ever increasing gap (red) between what is needed to fund school operations and what the state is providing. Since 2009 the State of Wisconsin has not provided an inflationary index to per pupil spending. The gap has grown to an amount of $3,160.20.
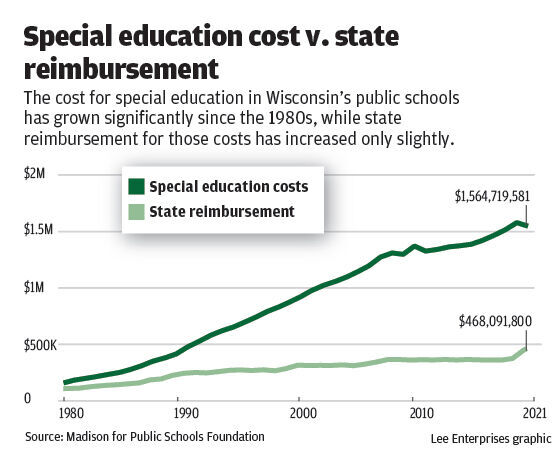
Special Education Cost compared to State Reimbursement
The graph shows the ever-increasing gap between the cost of Special Education and the rate of reimbursement provided by the state.
Links
This is a carousel with manually activated slides. Use slide dots to jump to any of the slides.